


Ever wonder if a split-second decision might be the key to transforming your investments? Real-time financial data gives you immediate access to all the important numbers, so you can make swift, confident choices, just like having a clear map when you’re planning a road trip.
Imagine watching live feeds that update you on today’s stock prices, cash flows, and market shifts. Outdated reports become a thing of the past, leaving you with exactly the information you need to spot new opportunities and act without hesitation.
In a market that never stops moving, these quick updates are like a secret tool, fueling your confidence and ensuring you're always one step ahead. It’s all about having the right insights at the right moment to help you make smarter moves faster than ever.
Live Financial Market Updates and Real-Time Financial Data Trends
Live market updates are changing how investors and businesses plan their strategies. With real-time data streams, you get up-to-the-minute details on stocks, bonds, commodities, and currency markets. Instead of waiting for month-end reports, decision-makers can instantly check crucial numbers like profit and loss, cash flow, and accounts receivable and payable. This quick access helps companies shift their strategies as soon as changes occur, boosting investor confidence with fast, informed decisions.
Imagine a retail company adjusting its ad spend mid-campaign after spotting a sudden sales boost through live feeds. This kind of speedy insight means that resources can be shifted exactly when needed, making all the difference in resource allocation. By cutting down on delays between spotting an issue and taking action, real-time data ensures decisions reflect what’s happening right now, rather than outdated projections. It gives you a clear advantage over competitors who depend on periodic reports.
Today, speed is more important than the size of your budget. Investors feel more confident when they can use instantaneous market streams to guide nimble financial planning and risk management. With live updates in hand, portfolios can be adjusted on the fly to catch emerging trends and opportunities. This responsive approach minimizes delays and bolsters financial stability in a rapidly changing market, making real-time data a key asset for smart, confident investing.
Key Sources Fueling Real-Time Financial Data Trends

Major exchanges set the stage for real-time financial data, delivering bite-sized insights that investors can act on immediately. The NYSE and NASDAQ, for instance, provide live stock prices, order book details, and volume data, making it easy to stay in tune with market shifts. The S&P 500 gives you a quick look at how the market as a whole is feeling, while cloud-based tools like Daloopa speed up data delivery for both big institutions and everyday traders. Together, these trusted analytics and economic signals form the foundation of today’s financial strategies.
Alternative data sources also add an extra layer to our understanding of the market. By including unconventional indicators such as satellite imagery, credit card transaction details, and weather patterns, investors can enjoy a richer, well-rounded perspective. APIs tie everything together by connecting core banking and accounting systems, so key figures like profit and loss, margin, and liquidity flow in seamlessly. This smart mix of big data empowers investors to act fast in a shifting landscape, boosting confidence and supporting agile decision-making.
| Source | Data Type | Latency | Coverage |
|---|---|---|---|
| NYSE | Stock Prices & Order Books | Near Real-Time | Global Stocks |
| NASDAQ | Volume Metrics & Price Quotes | Near Real-Time | Tech & Growth Sectors |
| S&P 500 | Market Sentiment | Real-Time Snapshot | US Equities |
| Daloopa | P&L, Margin & Liquidity | Low Latency | Institutional and Retail |
| Satellite Data Inc. | Imagery & Weather | Real-Time | Economic Impact Zones |
Volatility Pattern Analysis in Real-Time Financial Data Trends
Real-time data feeds give traders the ability to fine-tune their high-frequency strategies with fresh insights. By keeping a close eye on the market’s tiny movements, they can make smart calls quickly. Combining this data with social media sentiment analysis, yes, looking at what folks are saying online, helps investors confidently predict short-term shifts.
These live updates aren’t just numbers on a screen. They spotlight unusual volume spikes and sudden price changes, ensuring traders are always ready to take quick action when market volatility hits. Pulse dashboards add even more value by clearly showing metrics like spread shifts and rapid liquidity changes, which makes risk assessments and hedging decisions a lot simpler.
This instant access to volatility signals has completely changed the game for traders and portfolio managers. With real-time, data-driven insights, strategies can be adjusted on the fly to keep risks in check before they grow. In other words, advanced analytics paired with live feeds break down complex market moves into clear, understandable trends.
Simply put, investors now have a constant window into these market fluctuations, boosting their ability to respond swiftly in fast-paced situations.
Key signals to watch include:
- Sudden volume spikes
- Abrupt price swings
- Rapid spread changes
- Liquidity pattern shifts
- Divergent social sentiment trends
Algorithmic Signal Detection and High-Frequency Trading in Real-Time Financial Data Trends
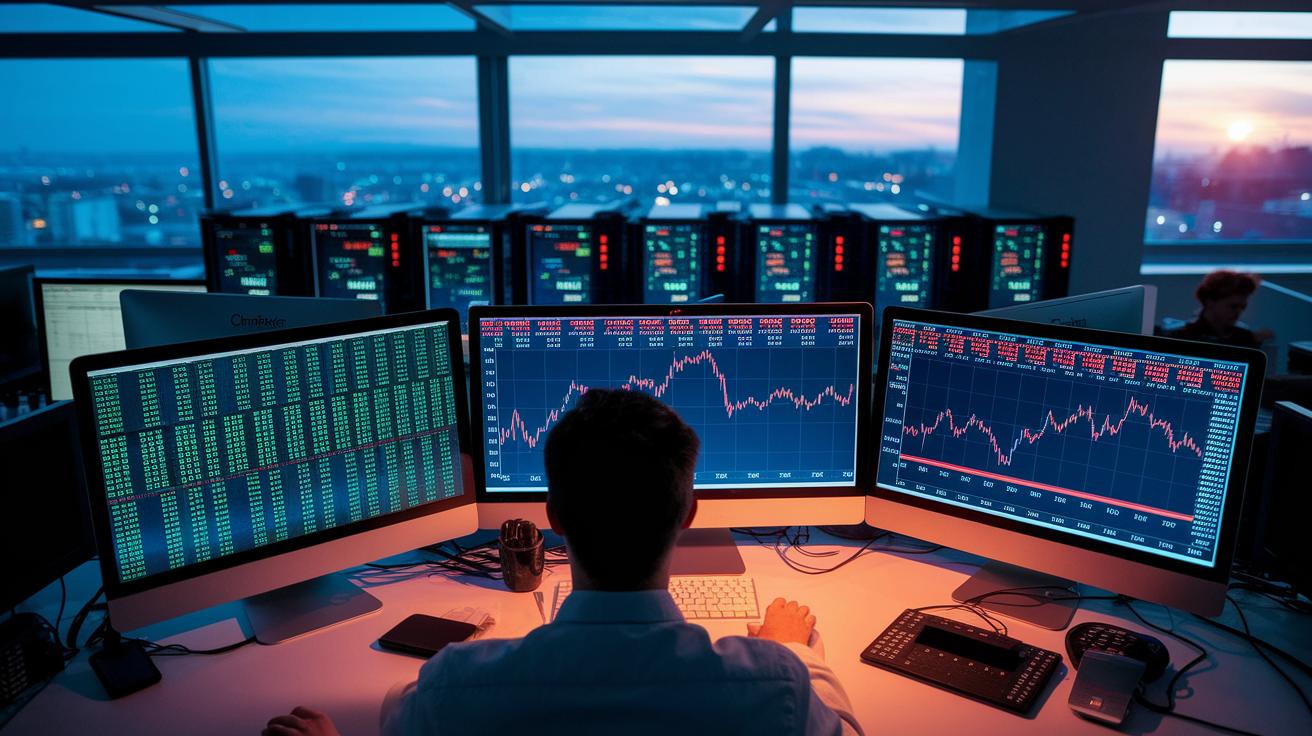
Algorithmic models work around the clock, keeping an eye on live market streams to catch small hints like order book imbalances and momentum shifts. They’re scanning real-time financial metrics, that is, numbers and patterns that give clues about market mood, before these details even catch a human trader’s eye. With super-fast tools like edge computing and distributed systems, these setups react almost as quickly as you would grab a jacket when a sudden chill hits.
Automated trading systems then step in, using preset thresholds to trigger trades once these signals get picked up. This process is key to staying ahead in high-frequency trading. Many institutional desks rely on cloud-based platforms to deploy their strategies at millisecond speeds, ensuring every trade is executed with precision. In this way, combining quick signal detection with automated actions helps investors tap into short-lived market chances with confidence.
On top of that, hybrid AI models refine the whole process by blending traditional methods with cutting-edge language models. These systems, offering accuracy rates between 63% and 66%, mix technical indicators with external cues to turn raw data into clear, actionable trading insights. This approach gives investors a better window into market dynamics, letting them tweak their strategies on the fly in today’s fast-paced trading environment.
Live Dashboard Reporting and Visualization of Real-Time Financial Data Trends
Pulse dashboards are completely changing how investors watch and understand live financial data. They pull together key numbers, like profit, loss, turnover, margin, and liquidity, into one simple, clear display. With easy drag-and-drop chart creation and adjustable refresh rates, you can quickly tweak the visuals to fit new market developments. Imagine a portfolio manager who sets up alerts to instantly learn about margin dips or sudden spikes in trading volume. This setup makes it much easier to react fast when the market shifts. And with augmented reality stepping in, you get an immersive, almost 3D look at the data, helping you grasp complex financial patterns in a very interactive way.
Tools like Daloopa also play an important role by automating data collection and standardization. This means fewer mistakes and a constant stream of updated insights, giving investors a clearer view of market trends. By combining user-friendly dashboards with interactive technology and automated data processes, these systems let you quickly spot trends and make smarter decisions, all with just a click.
Applying Predictive Modeling Techniques to Real-Time Financial Data Trends
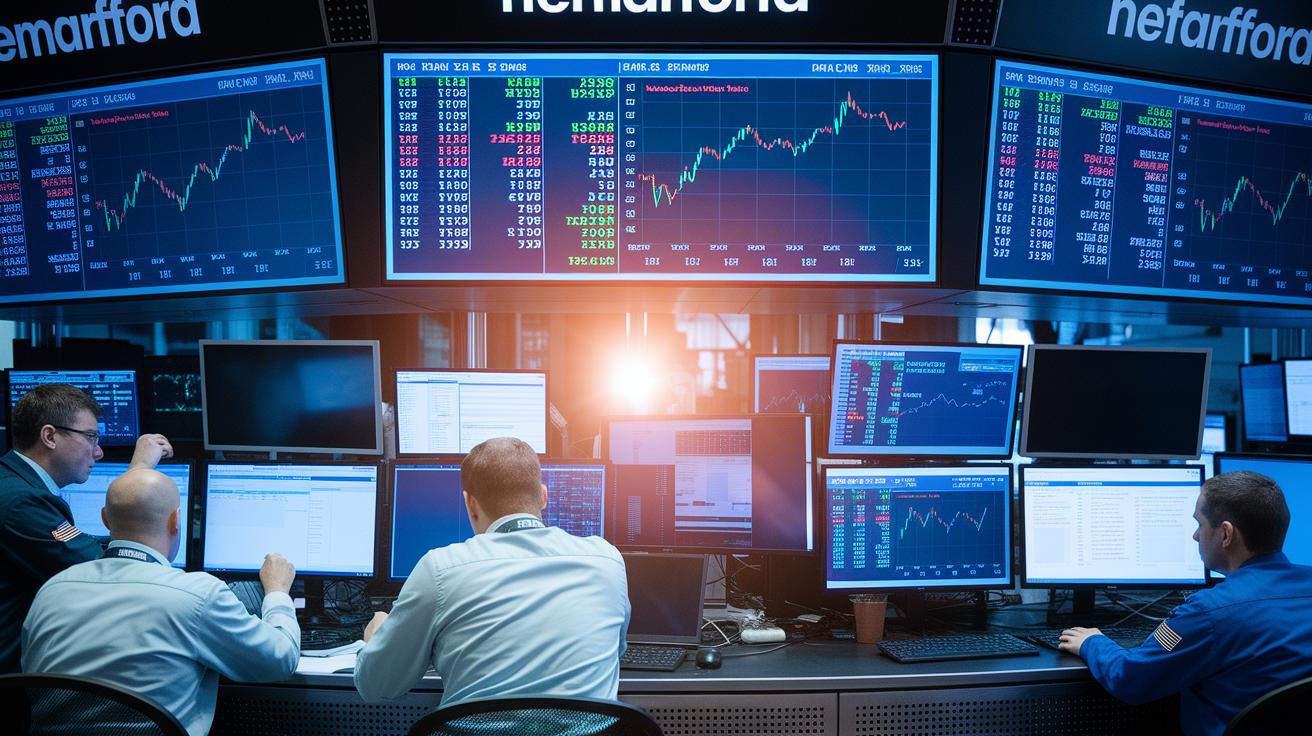
Predictive modeling has completely changed the way investors understand live market signals. These models use natural language processing to swiftly sift through news feeds and pick up on the emotional tone of the moment, so you can gauge the market’s mood as it unfolds. Machine learning takes this a step further by learning from historical data and even alternative sources to forecast short-term trends, making it easier to adjust investment strategies. For instance, if a sudden press release shifts sentiment, the model can quickly update its predictions, keeping investors ahead of any changes.
Neural networks play a key role in spotting those subtle signals across various asset classes. They combine real-time market information with broader economic indicators to capture every factor that might affect market movements. This smart mix of machine learning and detailed volatility forecasting helps investors notice trends that might otherwise fly under the radar. Think of it like this: when emerging market news shifts trading volumes, these models can signal a burst of short-term volatility.
Continuous monitoring through streaming feedback loops allows these models to fine-tune their settings as fresh data flows in. Each update makes the model a bit sharper, offering real-time insights that help investors adjust their portfolios before major shifts occur. In short, this ongoing adaptability not only refines forecasting accuracy but also boosts market resilience, giving investors extra confidence in their financial decisions.
Risk Management Frameworks Enhanced by Real-Time Financial Data Trends
Real-time financial data lets CFOs move fast by providing the instant updates they need to manage currency hedges and rebalance portfolios. This kind of timely insight means decision-makers can spot changes in market conditions right away, adjusting for counterparty exposures or shifting margin requirements. Think of it like catching a falling domino before it sets off a chain reaction, quick action can really make a difference.
Sensitive financial data relies on robust security measures, including encryption, multi-factor authentication, and GDPR compliance. These tools help protect information while real-time risk alerts flag potential issues as soon as they crop up. Picture a risk dashboard that immediately highlights when a margin threshold is close to being breached, nudging you to step in before any problems escalate. It’s all about staying one step ahead and keeping your system safe from unauthorized access or data breaches.
Cloud-based risk engines are changing the game for financial institutions by running live stress tests and calculating value-at-risk on the spot. Automated compliance analytics constantly sift through transaction flows to spot fraud or regulatory issues. Imagine a system monitoring thousands of transactions at once, quickly flagging any irregularities that might signal trouble. This kind of integration not only boosts portfolio performance but also gives you peace of mind, knowing your risk management is as solid as it gets.
Final Words
In the action, this article broke down live market updates, algorithmic signals, dashboard insights, and predictive models, showing how each element plays a role in effective financial planning and decision-making.
We explored everything from rapid market streams to risk management strategies, making complex topics feel approachable. With real-time financial data trends guiding your analysis, you’re set to make faster, smarter moves in both personal and business finance. Here's to a confident, clear path ahead.
FAQ
What do real-time financial data trends in the stock market indicate?
Real-time trends in the stock market indicate immediate changes in prices, volumes, and sentiment. They help investors respond quickly by providing up-to-date insights rather than waiting for end-of-day reports.
What does a live U.S. stock market chart display?
A live U.S. stock market chart displays current price movements, trading volumes, and investor sentiment across major exchanges like the NYSE and NASDAQ, offering a clear snapshot of ongoing market activity.
When does the U.S. stock market open today?
The U.S. stock market typically opens at 9:30 am Eastern Time, marking the start of trading on key exchanges such as the NYSE and NASDAQ each day.
What is the U.S. stock market index?
The U.S. stock market index tracks the performance of a select group of stocks, like the S&P 500, and serves as a benchmark for overall market trends and investor sentiment.
What is real-time financial data?
Real-time financial data is continuously updated market information across equities, fixed income, commodities, and more. It enables traders and businesses to make immediate decisions based on the latest market conditions.
What is the 7% rule in stock trading?
The 7% rule in stock trading refers to a profit target where traders aim for a roughly 7% gain before exiting a position, which helps manage risk and capture gains during volatile sessions.
Which data source is best for real-time financial market data collection?
The best real-time data sources usually include major exchanges and cloud-based platforms that provide low-latency, accurate feeds, making them ideal for professional trading and immediate market insights.
What if I invested $1000 in the S&P 500 10 years ago?
A $1000 investment in the S&P 500 10 years ago would likely have grown substantially due to market appreciation and reinvested dividends, though exact returns depend on market cycles and timing.