
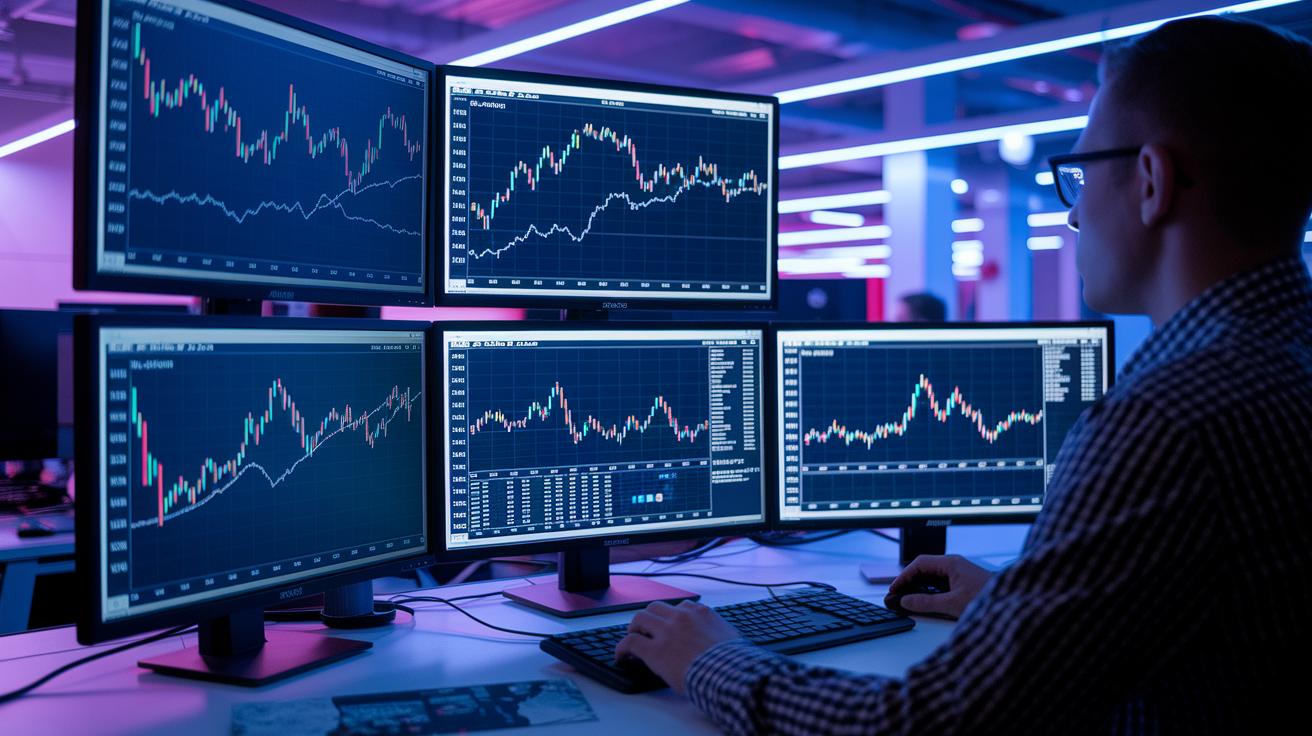

Have you ever thought about predicting the next big crypto move just by looking at charts? Technical analysis takes past price data and turns it into signals that help forecast market shifts. It uses trends and trading volume as clues to guide smarter decisions on when to buy or sell. In this post, we'll explore how these visual hints work together to form trading signals that might change the way you approach cryptocurrency.
Applying Technical Analysis for Cryptocurrency: Foundations and Overview
Technical analysis is all about looking back at historical price data and chart patterns to help figure out the best times to buy or sell cryptocurrencies. It relies on visual clues and statistical signals so traders can catch trends and shifts early, even before the fundamentals reveal anything. Start by setting a simple goal: reviewing past price charts to spot patterns that point to an upcoming market move.
At its core, technical analysis depends on two main pieces of data: price and volume. The price tells you the value at which a coin has been trading, while volume shows how strong that movement is. For example, support levels indicate spots where buyers might start overcoming sellers, and resistance levels mark areas where selling tends to take charge. Tools like oscillators and moving averages help turn raw data into clear signals, flagging conditions such as overbought markets or breakout opportunities.
- Technical analysis – using charts to find entry and exit points
- Fundamental analysis – looking at on-chain metrics and project details
- On-chain analysis – examining blockchain data for market sentiment and transaction flows
Technical analysis really shines when paired with fundamental and on-chain analysis. Imagine this: you spot some strong on-chain activity and the fundamentals of a project are looking up, and then technical analysis kicks in by showing you the precise moment when a coin hits a key support level. This integrated approach helps traders make smarter, more informed decisions based on solid data and clear trends.
Recognizing Chart Patterns in Cryptocurrency Technical Analysis
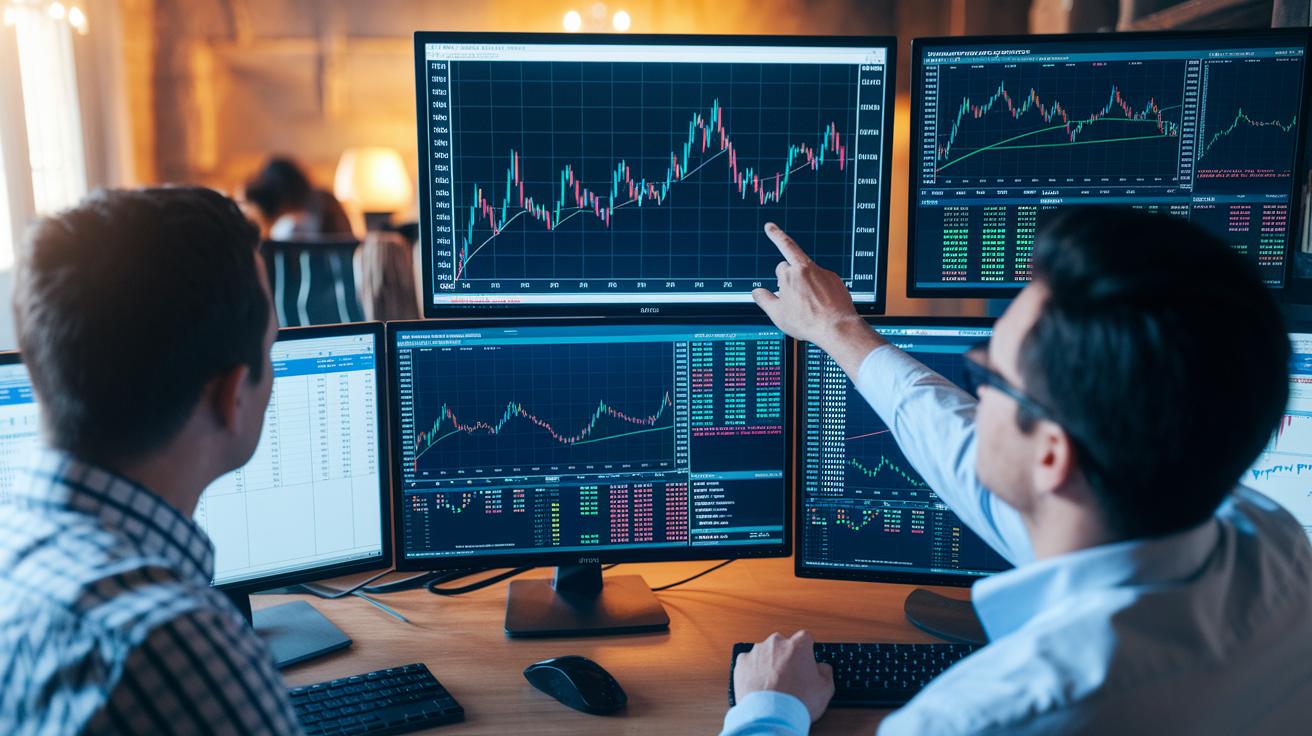
Chart patterns are a practical way to understand what’s happening in the crypto market. They give you a visual snapshot that hints at whether trends might continue or reverse, making it easier to predict price moves based on past behaviors. In short, these patterns can show you if a price move is strong or if it might lose momentum, without having to crunch endless numbers.
There are about seven key patterns most traders keep an eye on. For example, the head & shoulders pattern appears when a price forms a high peak with two slightly lower peaks on either side, often hinting at a reversal. Its flip side, the inverse head & shoulders, suggests a move upward instead. Then you have the double top and double bottom patterns. When prices hit similar highs twice, it might signal a bearish turn, while hitting the same low twice can point to bullish momentum. Ascending triangles are another example; they indicate that buyers are slowly pushing the price up, suggesting bullish pressure, whereas descending triangles indicate selling pressure. And don’t forget flags or pennants, these usually suggest that a trend is just taking a brief pause before picking up again. Think of a double bottom: after the price hits a low twice, it bounces back up, showing renewed buyer interest.
Adding extra tools to these visual clues can boost your confidence in trading decisions. For instance, using Bollinger Bands, a tool that measures how much the price moves away from an average, can confirm a chart pattern if the price repeatedly touches the outer bands and then reverts to the middle. Meanwhile, any spike in trading volume adds weight to the signal, because it shows more market participants are involved. Blending these indicators with chart patterns helps you avoid false signals, making your decisions sharper in the unpredictable world of crypto markets.
Essential Technical Indicators for Cryptocurrency Analysis
Technical indicators are like friendly tools that use simple math to turn price and volume data into clear signals about where the market might be headed. They help you notice if an asset is potentially overbought or oversold, and they can even highlight when a trend might be changing. Take the Relative Strength Index (RSI) for example, it looks at how fast prices are moving and changes in that speed, while the Moving Average Convergence Divergence (MACD) helps pinpoint shifts in trend strength, momentum, and how long a trend might last. Indicators such as Bollinger Bands set flexible upper and lower levels, offering hints that the price could be moving back towards its typical range. And when you use a Simple Moving Average (SMA), like the 50-day version, it smoothes out price data to help confirm what the trend really is. The Accelerator Oscillator (AO) and the Stochastic Oscillator complete this set by showing when price movements might be speeding up or slowing down, and by comparing the current price to its recent range, respectively.
| Indicator | Primary Signal/Use |
|---|---|
| Relative Strength Index (RSI) | Shows if an asset might be overbought or oversold by tracking price momentum |
| Moving Average Convergence Divergence (MACD) | Spotlights changes in trend strength, direction, and momentum |
| Bollinger Bands | Indicates volatility and potential for prices to revert to the mean |
| Simple Moving Average (SMA) | Smoothes out price data to help confirm ongoing trends |
| Accelerator Oscillator (AO) | Signals whether price trends are picking up speed or slowing down |
| Stochastic Oscillator | Compares the current price to its recent range to spot momentum changes |
| On Balance Volume (OBV) | Uses volume data to gauge buying and selling pressure |
While each indicator gives its own set of clues, many traders like to blend signals to get a clearer picture. For example, if the MACD shows a divergence at the same time the RSI indicates an oversold condition, that might be a hint that a reversal is on the way. And when Bollinger Bands tighten up while the price gets close to one of the bands, it could mean that the market is due for a move back toward its average. Of course, no single signal is guaranteed to be right every time. Combining multiple indicators along with other signals such as key support and resistance levels can help reduce false alerts and guide you to make more informed choices in the ever-changing crypto market.
Moving Averages and Trend Line Techniques in Crypto Analysis
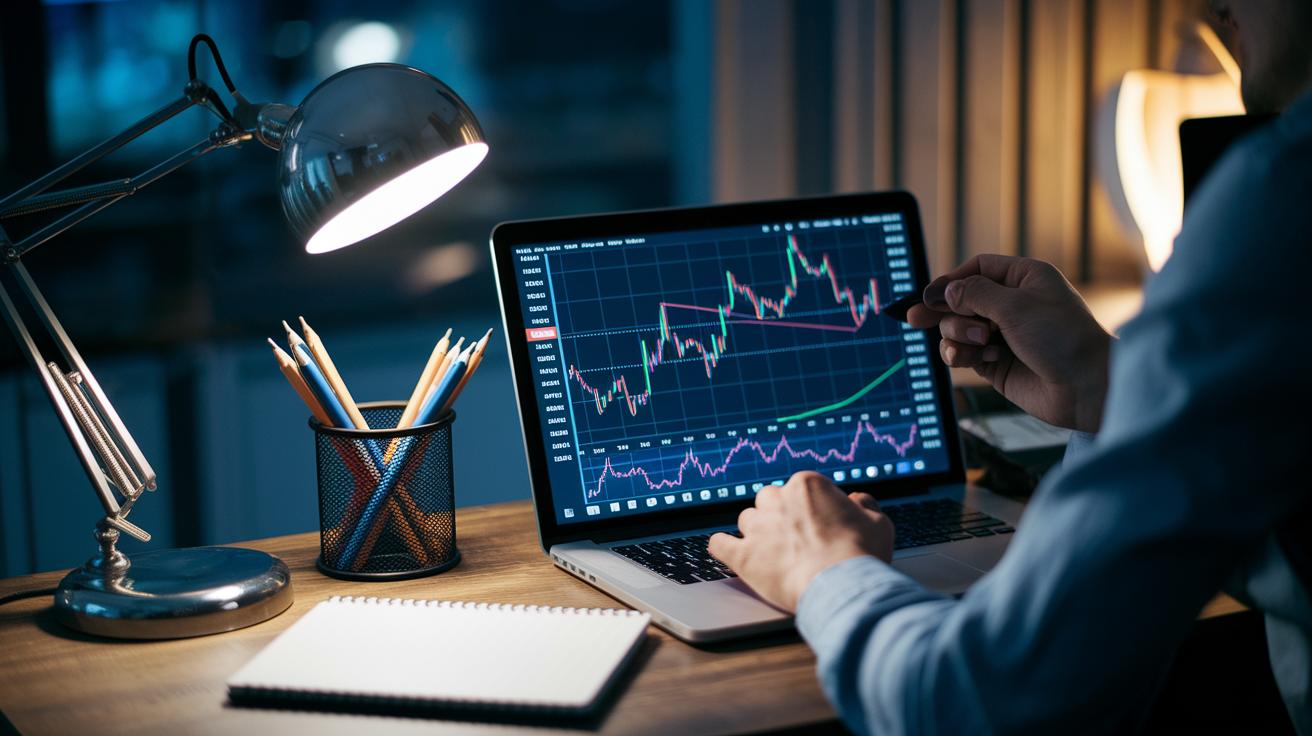
When it comes to trading cryptocurrencies, having simple, reliable tools is key to spotting market shifts. Moving averages and trend lines offer clear, visual cues that can help you understand whether prices are moving upward or downward.
For instance, many traders rely on a Simple Moving Average, like the popular 50-day SMA, which calculates the average of closing prices over the last 50 days. This method smooths out daily ups and downs, giving you a clearer look at the market's overall direction. And when you check out additional indicators like the MACD and RSI, you add an extra layer of insight. Imagine noticing that while prices are making lower lows, the MACD doesn't follow suit. If the RSI also indicates that the market is oversold, it might be pointing to an upcoming trend reversal. Ever try that simple test? It could be your best hint to reexamine your trading strategy.
Drawing trend lines is just as intuitive. You connect a series of consecutive highs or lows to form dynamic zones of support and resistance. This visual approach helps you quickly gauge how strong a trend really is. When prices tear through a well-drawn trend line, it could signal a breakout or a potential reversal in momentum. And that’s a perfect moment to explore new trading opportunities.
Support, Resistance and Fibonacci Retracement in Cryptocurrency Analysis
When you're exploring the crypto market, you come across familiar zones where a coin’s price tends to stall or even reverse direction. Think of support as the price floor – that level where buyers naturally step in, making it hard for the price to dip further. On the flip side, resistance is like a ceiling that often halts upward movement because sellers pile in. For example, if a coin repeatedly bounces up from a specific price, it's a clear sign that buyers see it as a sweet spot for potential purchases.
Fibonacci retracement levels add another helpful layer to your analysis. These levels are found by connecting a major high with a significant low on the chart, then marking out horizontal lines at percentages like 23.6%, 38.2%, 50%, and 61.8%. These percentages act as checkpoints, highlighting where the market might correct itself. So, if a digital asset surges and then backs off, hitting the 38.2% mark, it could be a signal for buyers to step in, expecting another upward push.
Mixing Fibonacci retracement with tools like the volume-weighted average price (VWAP) can really boost your trading game. VWAP takes into account both price and volume, offering a more balanced look at what traders are doing. When Fibonacci levels line up with VWAP, it gives you added assurance that a support or resistance level is indeed strong, making your decisions about when to get in or out a lot clearer.
Volume Analysis and Momentum Indicators in Cryptocurrency Technical Analysis

Volume analysis is a key tool that shows whether a price move in cryptocurrency is backed by real market participation. When you see a coin move dramatically, a rise in volume tells you that many traders are involved and that the move might stick around. Picture a coin climbing above a critical resistance level. If this breakout comes with higher volume, it's a good sign that the upward push is genuine and not just a short-lived spike. This kind of confirmation helps traders decide the right moments to get in or out of a trade.
The Accelerator Oscillator (AO) and the Stochastic indicator are also really handy for understanding market momentum. The AO gives you a sense of when trends are speeding up or slowing down, essentially offering clear buy or sell hints. Meanwhile, the Stochastic indicator compares the current price to its 14-day range, alerting you when a coin might be oversold or overbought. For example, if the AO shows increasing momentum while the Stochastic points to oversold conditions, it could be a smart time to consider a market entry, as a rebound might be on the horizon.
By combining volume spikes with signals from momentum indicators like the AO and Stochastic, you cut through the noise and reduce false alarms. This approach tightens your decision-making process, ensuring that any surge in trading activity truly backs the momentum signals, making your trading strategy more reliable.
Crypto Trading Analysis Software for Technical Charting
Crypto charting platforms are packed with features that help you make smarter trading decisions. They provide a wide range of mathematical formulas and technical indicators to break down price and volume data into something more digestible. They also let you backtest your strategies, simulating past trades to see how your plan might have performed historically. Plus, you can use custom scripting to set up your own trading rules and automate parts of your strategy. Imagine a setup where a trade executes automatically whenever a moving average crossover happens, giving you a systematic way to trade without watching the market every minute.
Interactive charting transforms raw data into dynamic visuals that reflect real-time market conditions. These platforms keep your charts up-to-date as new trading data comes in, ensuring you always have a fresh perspective on market trends. With features like zoomable timeframes and customizable layouts, you can adjust your view to focus on those key levels where trends start and reverse. Picture the market unfolding before your eyes on an interactive chart, complete with overlay indicators that guide you toward pinpointing just the right moments to enter or exit a trade.
Then there’s the power of automated scanning and strategy integration. Advanced platforms continuously scan the market using preset indicator thresholds to highlight trade opportunities that match your specific criteria. These automated scanners work side-by-side with manual trading tools, so you can mix algorithm-driven alerts with your own analysis. For example, you might set an alert that triggers when a volatility indicator spikes while a trend indicator confirms an upward move. This blend of automation and hands-on strategy helps you manage risk more effectively and streamline your trading process.
Risk Management Strategies in Cryptocurrency Technical Analysis

Relying on just one indicator can lead you astray. You might see an oversold signal that seems like a great time to buy, but cryptocurrencies can stay in that state longer than you expect. And an overbought signal doesn’t always mean prices will drop. It’s like trying to complete a puzzle with only one piece, you simply don’t get the full picture of market behavior.
A smarter approach is to mix several signals to build confidence in your decision. Suppose your oscillator shows an oversold condition while the price nears a familiar support level, and you also notice a spike in trading volume. That combination might be hinting at a good entry point. In these cases, placing a stop-loss order can help shield your investment by automatically exiting the trade if the market turns unexpectedly. This way, you can limit potential losses and still catch the upside, making your trading strategy more resilient.
Another key point is position sizing and staying disciplined. By capping the portion of your portfolio you risk on any one trade, you reduce the blow of a single loss. Following your set trade size and exit plan helps keep your emotions in check even when the market gets wild.
Final Words
In the action, we covered the essentials, technical analysis for cryptocurrency, chart patterns, key indicators, trend techniques, and risk management.
We looked at how combining these tools with trusted software can sharpen decision-making and simplify complex financial ideas.
This approach supports smarter budgeting and investing while building financial confidence. Keep experimenting and learning with clear, straightforward methods for a secure and exciting financial future.
FAQ
Technical analysis for cryptocurrency PDF free download
The technical analysis for cryptocurrency PDF free download offers a comprehensive guide with charts, indicators, and price-action methods. It helps traders learn how to spot entry and exit signals in crypto markets.
Free technical analysis for cryptocurrency
The free technical analysis for cryptocurrency provides online resources and tools that explain charting techniques, indicator use, and trend analysis at no cost. It’s ideal for those just starting to learn.
Crypto technical analysis for beginners
Crypto technical analysis for beginners introduces basic methods such as chart patterns, moving averages, and support/resistance levels. It lays out the fundamentals to build confidence in assessing market trends.
Crypto technical analysis website
A crypto technical analysis website offers interactive charts, real-time data, and indicator tools. It gives users a clear view of price movements and market trends to spot potential trading opportunities.
Crypto analysis today
Crypto analysis today focuses on the current market environment by highlighting trending patterns, volume changes, and indicator signals. It helps traders make informed decisions based on up-to-date data.
Crypto technical analysis app
A crypto technical analysis app delivers mobile-friendly charting tools, real-time updates, and essential indicators. It enables traders to monitor price movements and market trends conveniently on their devices.
Crypto technical analysis chart
A crypto technical analysis chart visually displays price movements, support and resistance levels, and key indicator signals. It helps traders quickly identify trends and potential reversal points in the market.
Which technical analysis is best for cryptocurrency?
The best technical analysis for cryptocurrency often involves a blend of methods like chart patterns, oscillators, and moving averages. This combined approach provides a comprehensive view of trend strength and reversal signals.
Can you do technical analysis on crypto?
Technical analysis on crypto is done by assessing historical price data, chart patterns, and indicators such as RSI or MACD. This method assists traders in choosing entry and exit points based on market behavior.
What is the 1% rule in crypto?
The 1% rule in crypto means limiting the risk on any single trade to 1% of your trading account. It’s a strategy aimed at protecting your capital and minimizing losses.
What is the 80 20 rule in crypto?
The 80/20 rule in crypto suggests that a small portion of your investments, around 20%, could generate 80% of the profits. It guides traders to focus on their most impactful positions.