


Gold is on the rise, and it’s hard not to notice. XAU/USD has just smashed through an important barrier and is now riding a strong bullish wave. Sure, some folks might think this is just a quick spike, but the numbers are telling a different story. When prices surged past $4,381.44, it showed that breakouts can turn challenges into chances for further gains. In this post, we’re going to chat about why these signals matter and what they might mean for traders eager to catch this upward momentum.
XAU/USD Technical Analysis: Bullish Trend Signals
Spot gold is showing a clear burst of strength. Prices have broken above the previous key level of $4,381.44 and are now hovering around $4,532 per ounce. This breakout has pushed XAU/USD into a space with little immediate resistance, sparking interest among traders who appreciate the swift upward movement.
The current price is about $1,110 higher than its 52-week moving average of $3,439.44. This indicator helps confirm a strong bullish trend. The substantial 72% year-to-date surge hints that the market might be a bit overbought right now, although the momentum is hard to ignore. In simple terms, the consistent upward momentum suggests that we could see further gains, even if some signals suggest we stay a bit cautious.
Several factors are fueling this optimistic outlook. A weak US dollar, central bank purchases, and rising geopolitical tensions are all boosting investor confidence. Plus, talk of Federal Reserve rate cuts is making gold even more appealing as a safe-haven asset. If you’re keen to track these live market updates, you might want to check out real-time data at https://moneyrepo.com?p=1736. This can give you an up-close view of how prices and critical pivot points are evolving in the bullion market.
Key Support and Resistance Levels in XAU/USD Trading
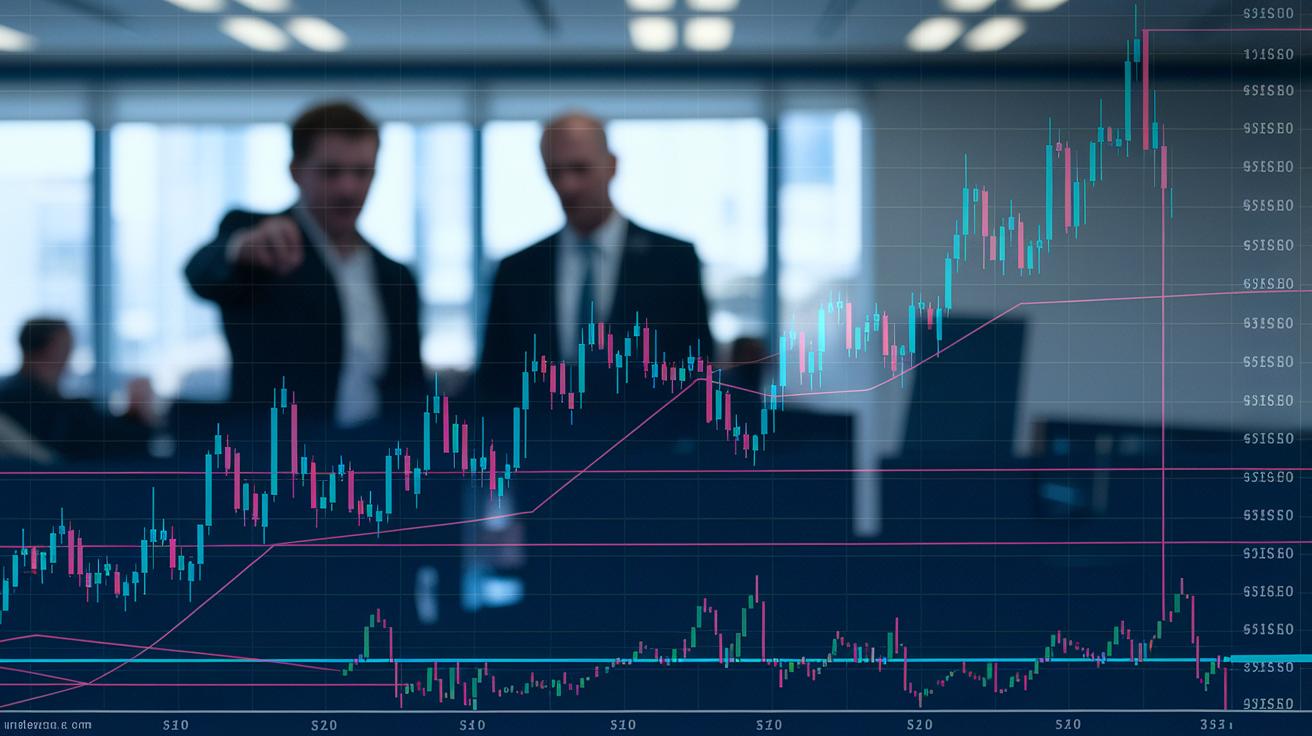
Gold’s price movements often revolve around clear support and resistance levels that serve as guideposts for potential reversals or breakouts. When a level that once acted as a roadblock shifts to become supportive, or vice versa, it can signal a change in market sentiment. This simple shift might be your cue to adjust your positions, helping you better time your entries and exits in the gold market.
| Level | Type | Value |
|---|---|---|
| Main Zone | Former Resistance / Now Support | $4,381.44 |
| Secondary Zone | 50% Retracement Support | $4,218.30 |
| Upcoming Barrier | Resistance | $4,645.91 |
It’s a good idea to keep a close watch on these levels as they can offer clues about the market’s short-term direction. For instance, when the $4,381.44 level flips from resistance to support, it acts like a safety net during brief pullbacks. And if the price manages to break through the $4,645.91 barrier, it might open up new opportunities as prices venture into fresh territory. Plus, with tools like Elliott Wave pivot points highlighting correction zones, you get a more adaptable trading strategy, especially in a bullish market environment for gold.
Moving Averages and Momentum Indicators for XAU/USD
When XAU/USD is trading roughly $1,110 above its 52-week moving average of $3,439.44, it sends a clear, friendly message to traders, the market is riding a strong bullish wave. Moving averages work like a filter, smoothing out the everyday price noise so you can see the real trend beneath. When prices stay well above this average, it’s a signal that upward momentum has a solid grip on the market. For instance, that noticeable gap shows that buyers have been stepping in consistently, keeping the trend alive.
Oscillators, such as the relative strength index (RSI) and the 4-hour stochastic oscillator, add another layer of insight into this momentum. Even though the trend looks robust, these indicators hint that the market might be tipping into overbought territory, especially with a 72% gain so far this year. Traders might notice that RSI readings are getting pretty high, nudging them to consider whether a short-term pullback might be on the horizon.
By combining these signals, you’re better equipped to time your entries and exits. Watching moving average crossovers can provide early warnings of a potential reversal, while keeping an eye on the oscillators helps spot moments when a correction might be due. In a nutshell, blending the steady guidance of moving averages with the timely cues from momentum indicators gives you a practical way to manage positions in a market that’s largely bullish but showing subtle signs of being a bit overextended.
Chart Patterns and Breakout Signals in XAU/USD Analysis

A clean breakout above the $4,381 main top has sparked a noticeable change in market behavior. Gold prices surged upward sharply after this move. It wasn't a fluke; the breakout kicked off a parabolic rally that’s now eyeing a target around the week ending January 10. Recent 4-hour candlestick readings give us mixed signals, mostly because the holiday period brought thin trading volume. Before this breakout, gold was quietly squeezing into a narrow range, getting ready for what came next. The consolidation between $4,530 and $4,550 was crucial as traders built positions in a calm environment before the decisive upswing.
Parabolic Rally Setup
The parabolic rally comes off a steep, rapid price increase once that breakout happened. It feels like an aggressive buying spree that pushed prices well beyond the initial resistance zone. This burst of energy shows that buyers are excited to explore new territory with fewer hindrances. In simple terms, once gold broke through, everyone wanted a piece, fueling that sharp, energetic move.
Consolidation Patterns
On the flip side, the earlier consolidation phase was all about tightening price movements between $4,530 and $4,550. Think of it like a pressure cooker slowly building up steam. During this period, market participants were gradually gathering positions, which set the stage for the intense rally that followed. It’s a classic example of how a period of calm can lead to a burst of activity once the pressure finds a release.
XAU/USD Price Forecast and Trading Plan
Today’s market setup shows a clear chance to take advantage of gold’s recent strength. We’re noticing that gold has built enough momentum to reach a resistance level near $4,610. Selling around this level lets you secure gains from the recent rally while reducing your exposure if the price reverses unexpectedly.
We recommend entering a sell order as gold nears the $4,610 mark, aiming for a target of $4,300 while keeping a stop-loss at $4,667. This approach helps you keep control and manage risk in an environment where gold is testing previous highs.
| Entry Level | Target | Stop-Loss |
|---|---|---|
| Sell near $4,610 | $4,300 | $4,667 |
Looking ahead to next week, expect moderate fluctuations driven by key economic events, such as the FOMC minutes release. This event could shift market momentum, so it might be wise to stay alert and monitor your positions closely. If you’re curious about handling such volatility, checking out insights on market trends can sometimes be really helpful.
Over the next 30 days, gold is projected to settle in a narrow range, roughly between $4,310 and $4,339.62 by the end of December. This forecast gives you a clearer picture of the short-term movement, allowing for cautious planning as the market adjusts.
In the medium term, things might get even more interesting. Early next year, especially around February and March 2025, gold could test record highs again. However, given potential corrections from upcoming CPI reports and further Fed decisions, staying flexible with your strategy is key.
All in all, this balanced plan is designed to help you make the most of today’s highs while positioning yourself for new trends. It’s about managing risk smartly and keeping an eye on market shifts to guide your decisions.
Risk Factors and Market Drivers Impacting XAU/USD Technical Analysis

Today’s XAU/USD trends are largely shaped by a mix of fundamental drivers and clear market volatility. For instance, a weakening USD and active central bank purchases have been pushing prices upward. At the same time, ongoing geopolitical issues, in places like Venezuela, Nigeria, the Middle East, and the Russia-Ukraine region, are stirring investor sentiment. Expectations of Fed rate cuts further strengthen long positions, adding fuel to the bullish outlook for gold. And don’t forget, trading during light holiday sessions can sometimes make the market more unpredictable due to lower volume and potential manipulation.
Given these influences, it’s important for traders to stick to strict risk controls and carefully manage position sizes. When markets appear overbought, having a clear plan for entry and exit becomes crucial because trend reversal signals may warn of short-term pullbacks. Setting defined stop-loss orders and closely monitoring key technical signals can help you balance the upward momentum with the market’s inherent uncertainties. This disciplined approach not only aims to maximize returns but also protects your portfolio during unexpected downturns.
Final Words
In the action, this article breaks down the bullish trend in XAU/USD by highlighting price action, support and resistance zones, and momentum indicators. It also outlines key breakout patterns and provides a detailed trading plan.
We covered vital market drivers and risk factors, giving readers a solid framework for using xau usd technical analysis to inform their decisions. The insights shared help sharpen your strategy and boost your confidence in making smart money moves. Enjoy the clarity and keep moving forward!
FAQ
Q: XAUUSD today buy or sell?
A: XAUUSD today buy or sell signals suggest a buy due to strong bullish trends, breakout levels, and ongoing momentum; still, monitor overbought conditions before making a firm commitment.
Q: Is XAUUSD bullish or bearish?
A: XAUUSD is bullish, as shown by its sustained uptrend, key breakout levels, and strong moving average support, though overbought indicators imply potential short-term pullbacks.
Q: What is the gold prediction for XAUUSD?
A: The gold prediction forecasts a move toward targets around $4,310 to $4,340 over the next 30 days, with record highs possible later; traders should keep an eye on macro events.
Q: Does gold go up when USD goes down?
A: When the U.S. dollar weakens, gold typically rises because investors favor safe-haven assets during currency downturns, which can drive demand and higher prices.
Q: What technical indicators are best for XAUUSD?
A: Important indicators include moving averages, RSI, stochastic oscillators, and chart patterns, all of which help identify entry and exit points in gold trading.
Q: Where can I find live XAUUSD signals and free technical analysis?
A: Live signals and free technical analysis charts are available on platforms like TradingView and other real-time financial data sites, offering continuous market insights.
Q: Is there a downloadable XAUUSD technical analysis PDF available?
A: Some financial websites provide downloadable PDFs that summarize XAUUSD technical analysis, covering price action, support/resistance levels, and momentum indicators for offline review.